

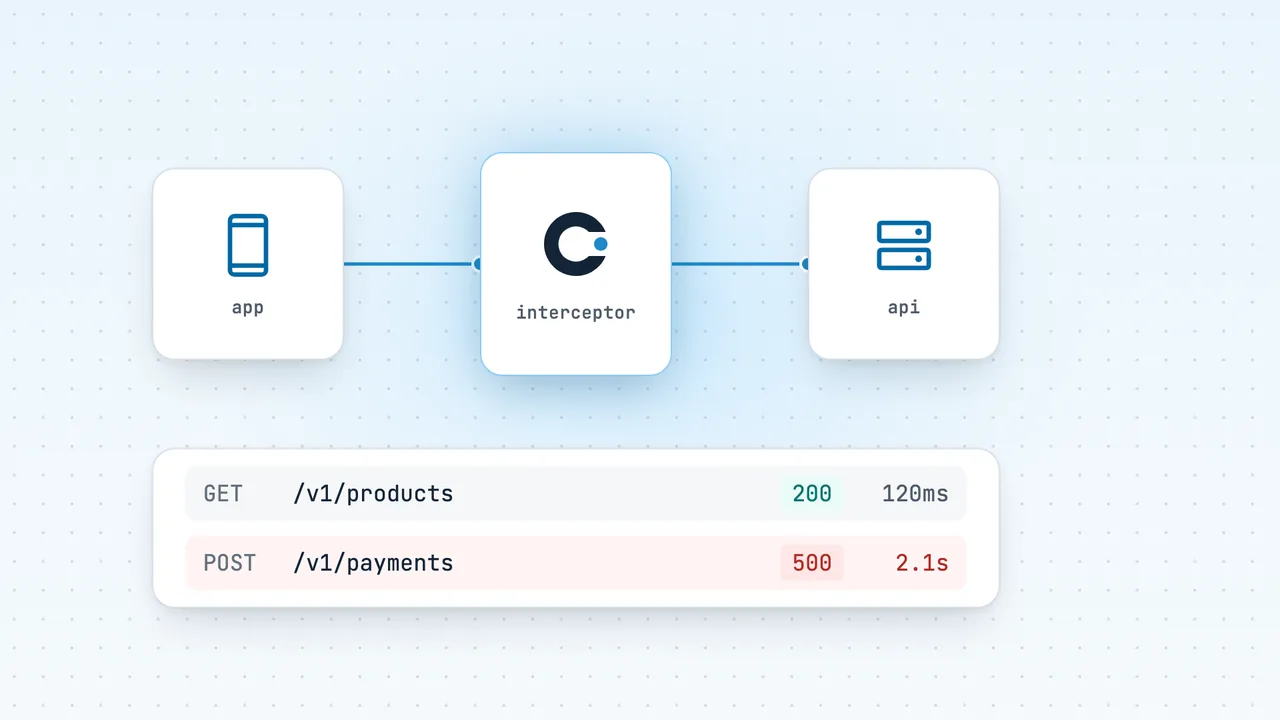
To monitor network calls in an Android app, add an application interceptor to record failed requests (4xx, 5xx, timeouts, connection errors) and an EventListener to record timings (DNS, connect, TLS, time to first byte, total). Use HttpLoggingInterceptor only in debug builds: at HEADERS or BODY level it can leak Authorization headers, cookies and request bodies into your logs. Whatever you record, strip query strings and redact credentials before the data leaves the device.
This guide shows each piece with Kotlin code, then how Codeskop's tracker-okhttp adapter does the same with one line. If you're working on app stability in general, read Android ANRs: causes, detection and fixes, because blocking on network calls is a classic ANR cause. The Codeskop side is in the network capture docs. Flutter teams using Dio can apply the same ideas; see Flutter error handling.
Application vs network interceptors
OkHttp lets you register an interceptor at two points. The OkHttp interceptors docs compare them:
Application interceptor (addInterceptor) | Network interceptor (addNetworkInterceptor) | |
|---|---|---|
| Called | Once per call, even if the response comes from the cache | For each network request, including redirects and retries; not for cached responses |
| Sees | The app's original request, without OkHttp-added headers such as Accept-Encoding: gzip | The request exactly as sent over the wire |
| Connection | chain.connection() is null | Has the Connection (IP address, TLS details) |
| Can short-circuit or retry | Yes | No (it must call proceed once) |
For monitoring, use an application interceptor. It sees one outcome per logical call, including the final result after redirects and retries, which is what your users experience. Use a network interceptor when you need to see what actually went over the wire, for example to debug a redirect loop or check compression headers.
val client = OkHttpClient.Builder() .addInterceptor(FailureInterceptor()) // application: one outcome per call .addNetworkInterceptor(WireDebugInterceptor()) // network: every hop, debug only .build()Catch crashes and ANRs in production
Add com.codeskop.sdk:tracker-android from Maven Central (minSdk 24). It starts on its own, with no init code required.
HttpLoggingInterceptor and its pitfalls
OkHttp's logging interceptor is the quickest way to see traffic. Keep its version in step with your OkHttp version (the BOM helps):
dependencies { implementation(platform("com.squareup.okhttp3:okhttp-bom:5.5.0")) implementation("com.squareup.okhttp3:okhttp") implementation("com.squareup.okhttp3:logging-interceptor")}The levels are NONE, BASIC (request line and response status), HEADERS and BODY. OkHttp's own README warns that logs at HEADERS or BODY level "have the potential to leak sensitive information such as 'Authorization' or 'Cookie' headers and the contents of request and response bodies", and should only be used in a controlled way or outside production.
A safe configuration:
val logging = HttpLoggingInterceptor().apply { level = if (BuildConfig.DEBUG) { HttpLoggingInterceptor.Level.BODY } else { HttpLoggingInterceptor.Level.NONE } redactHeader("Authorization") redactHeader("Cookie") redactHeader("Set-Cookie")}The pitfalls we see most often:
- Shipping
BODYin release. Logcat ends up in bug reports and in any log-forwarding SDK. Phone numbers, OTPs, M-Pesa transaction details and tokens in request bodies all leak this way. - Forgetting custom auth headers.
redactHeaderonly redacts what you name. If your API usesX-Api-KeyorX-Session-Token, add them. - Tokens in query strings.
redactHeaderdoesn't touch URLs.?token=...is logged as-is at every level. - Using logs as monitoring. Logs on a user's phone never reach you. Logging is a debugging tool; monitoring means sending structured, redacted events to a server.
Recording failures with an application interceptor
This interceptor records every call that fails: a non-2xx response or an IOException (timeout, DNS failure, connection reset). It never changes the response, and it rethrows exceptions so your app behaves exactly as before.
class FailureInterceptor( private val recorder: NetworkRecorder,) : Interceptor { override fun intercept(chain: Interceptor.Chain): Response { val request = chain.request() val started = System.nanoTime() val path = request.url.encodedPath // no query string val response = try { chain.proceed(request) } catch (e: IOException) { recorder.failure(request.method, request.url.host, path, status = null, kind = errorKind(e), tookMs = elapsedMs(started)) throw e } if (!response.isSuccessful) { recorder.failure(request.method, request.url.host, path, status = response.code, kind = if (response.code >= 500) "http_5xx" else "http_4xx", tookMs = elapsedMs(started)) } return response } private fun errorKind(e: IOException) = when (e) { is SocketTimeoutException -> "timeout" is UnknownHostException -> "dns" is InterruptedIOException -> "timeout" // includes call timeouts else -> "network_error" } private fun elapsedMs(start: Long) = (System.nanoTime() - start) / 1_000_000}Two details matter when you aggregate. First, use the path, not the full URL, and collapse IDs (/orders/42 → /orders/{id}) so failures group sensibly. Second, record a 3xx only if your client doesn't follow redirects. By default OkHttp follows them, and the application interceptor sees the final response.
Measuring latency with EventListener
An interceptor can time a whole call, but it can't tell you where the time went. EventListener receives callbacks for each phase: callStart, dnsStart/dnsEnd, connectStart, secureConnectStart/secureConnectEnd, connectEnd, connectionAcquired, the request and response header and body events, connectionReleased and finally callEnd, or callFailed if the call fails permanently.
Because calls run concurrently, create one listener per call with a Factory:
class TimingListener( private val call: Call, private val sink: (CallTiming) -> Unit,) : EventListener() { private val start = System.nanoTime() private var dnsStart = 0L; private var dnsMs = -1L private var connectStart = 0L; private var connectMs = -1L private var tlsStart = 0L; private var tlsMs = -1L private var ttfbMs = -1L override fun dnsStart(call: Call, domainName: String) { dnsStart = System.nanoTime() } override fun dnsEnd(call: Call, domainName: String, inetAddressList: List<InetAddress>) { dnsMs = ms(dnsStart) } override fun connectStart(call: Call, inetSocketAddress: InetSocketAddress, proxy: Proxy) { connectStart = System.nanoTime() } override fun secureConnectStart(call: Call) { tlsStart = System.nanoTime() } override fun secureConnectEnd(call: Call, handshake: Handshake?) { tlsMs = ms(tlsStart) } override fun connectEnd(call: Call, inetSocketAddress: InetSocketAddress, proxy: Proxy, protocol: Protocol?) { connectMs = ms(connectStart) } override fun responseHeadersStart(call: Call) { ttfbMs = ms(start) } override fun callEnd(call: Call) = emit(failed = false) override fun callFailed(call: Call, ioe: IOException) = emit(failed = true) private fun emit(failed: Boolean) = sink( CallTiming(call.request().method, call.request().url.encodedPath, dnsMs, connectMs, tlsMs, ttfbMs, totalMs = ms(start), failed = failed) ) private fun ms(from: Long) = (System.nanoTime() - from) / 1_000_000 class Factory(private val sink: (CallTiming) -> Unit) : EventListener.Factory { override fun create(call: Call): EventListener = TimingListener(call, sink) }} val client = OkHttpClient.Builder() .addInterceptor(FailureInterceptor(recorder)) .eventListenerFactory(TimingListener.Factory { timing -> recorder.timing(timing) }) .build()Things to know:
- Pooled connections skip DNS, connect and TLS. The OkHttp docs show a second request to the same host firing only
connectionAcquiredand the request/response events. A-1for those phases is normal. - Retries fire events more than once.
connectFailed()isn't terminal if OkHttp recovers, so keep the last value or sum them, but be consistent. - Keep callbacks cheap. They run on OkHttp's threads, inside the call. Hand the data to a queue; don't do disk or network I/O in the callback.
- One factory per client.
eventListenerFactorytakes a single factory. To combine several listeners, write a small delegating listener. - Sample timings, not failures. Every call produces a timing, so sample those (the docs show a factory returning
EventListener.NONEfor 90% of calls). Keep every failure.
Measuring failures and latency that matter
Once you have the data, a few views answer most questions:
- Failure rate per endpoint (
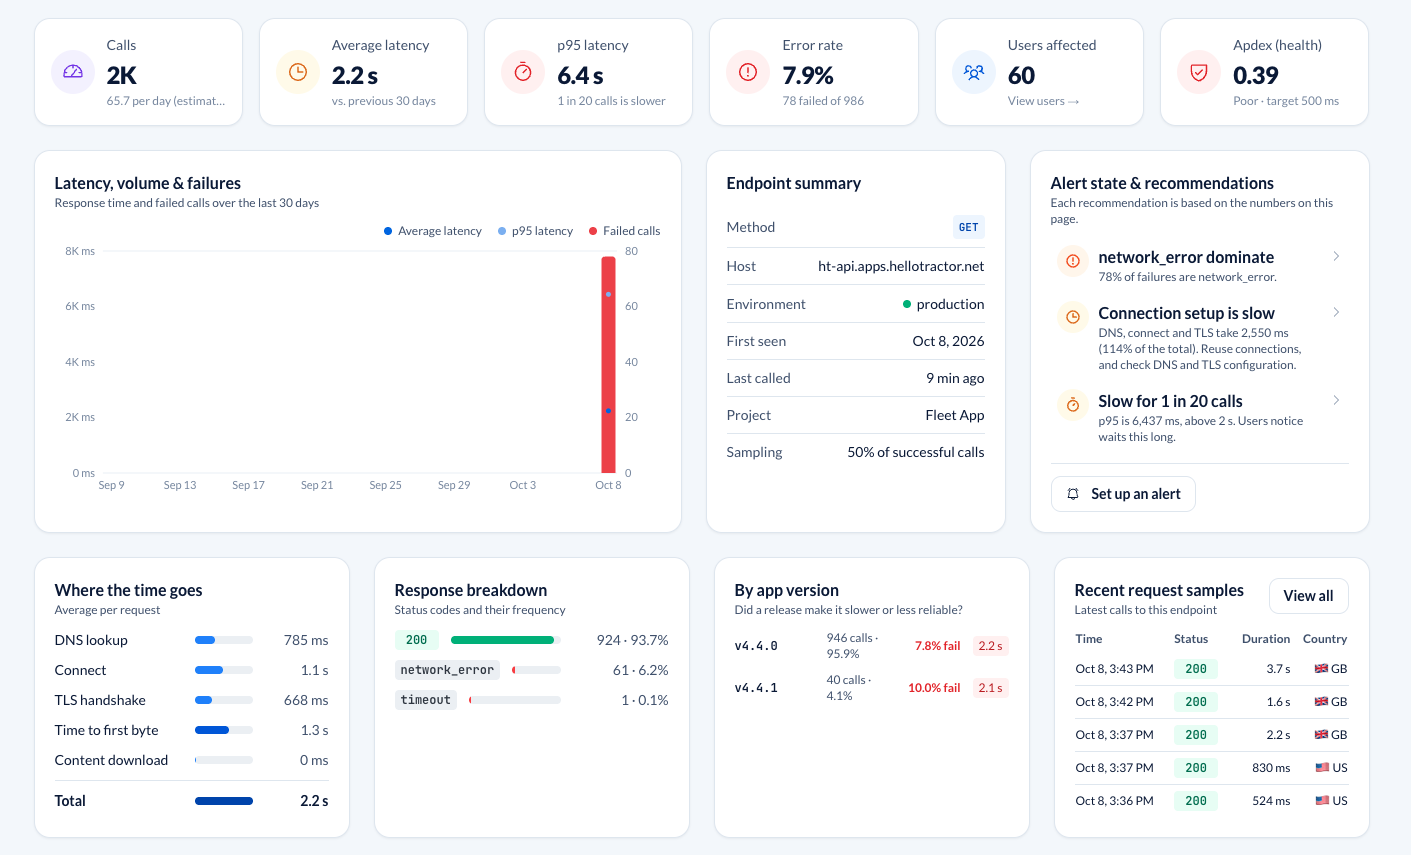
method + path), split by status class and error kind. A spike intimeoutwith no rise inhttp_5xxpoints at the network or a slow dependency, not a crashing server. - p50 and p95 total time per endpoint, and the phase breakdown for slow calls. High DNS and connect times with a normal TTFB is a network problem; high TTFB is a server problem.
- Breakdown by app version, device and network type, so you can tell a bad release from a bad area.
This matters in markets like Kenya. Outside the main cities, 3G coverage is patchy and DNS and TLS setup on a congested cell can dominate total time. Payment flows that call the M-Pesa Daraja API can time out while waiting on a callback. A per-phase breakdown tells you whether to fix your server, your timeouts or your retry logic.
Note
Network route analysis results on Codeskop below
Redacting headers and URLs
Before sending anything off the device:
- Drop the query string:
request.url.newBuilder().query(null).build(), or just recordencodedPath. - Allow-list headers rather than block-listing them. Record
Content-Type,Content-LengthandCache-Control; neverAuthorization,CookieorSet-Cookie. - Never record bodies in production monitoring. Record sizes instead (
request.body?.contentLength(),Content-Lengthon the response). - Collapse IDs in paths so user or order numbers don't become personal data in your metrics.
Network capture with Codeskop
If you'd rather not build and maintain this yourself, Codeskop's tracker-okhttp adapter registers both pieces, a failure interceptor and an event listener, with one line. Network capture is included on the Starter plan and above ($49/month as of October 2026; see pricing). On Free, the SDK doesn't capture network calls even with the adapter installed; upgrading switches it on without a new release.
dependencies { implementation("com.codeskop.sdk:tracker-android:0.3.0") implementation("com.codeskop.sdk:tracker-okhttp:0.3.0") // optional: network capture}import com.codeskop.sdk.okhttp.codeskopimport okhttp3.OkHttpClient val client = OkHttpClient.Builder() .codeskop() // failed requests + timing for every request .build()OkHttp has no global hook, so adding the dependency alone captures nothing. Build the client your app actually uses (including the one you pass to Retrofit) with .codeskop(). If you already set your own eventListenerFactory, keep it and add just the interceptor:
val client = OkHttpClient.Builder() .addInterceptor(CodeskopOkHttpInterceptor()) // keep your own eventListenerFactory .eventListenerFactory(myListenerFactory) .build()What it records, per the network capture docs:
- Failures: any 4xx or 5xx response, timeout or connection failure, with error kinds
http_4xx,http_5xx,timeoutornetwork_error. Your exception still reaches your code unchanged. - Timings: DNS, connect, TLS, time to first byte and total for each completed request. Timings are sampled through remote config; failures are always kept.
- Context: method, host and path, request and response sizes, and the device, app version and user.
- Never captured: request and response bodies, query strings, and the
Authorization,CookieandSet-Cookieheaders. Any header inredactHeadersis masked as a second safeguard.
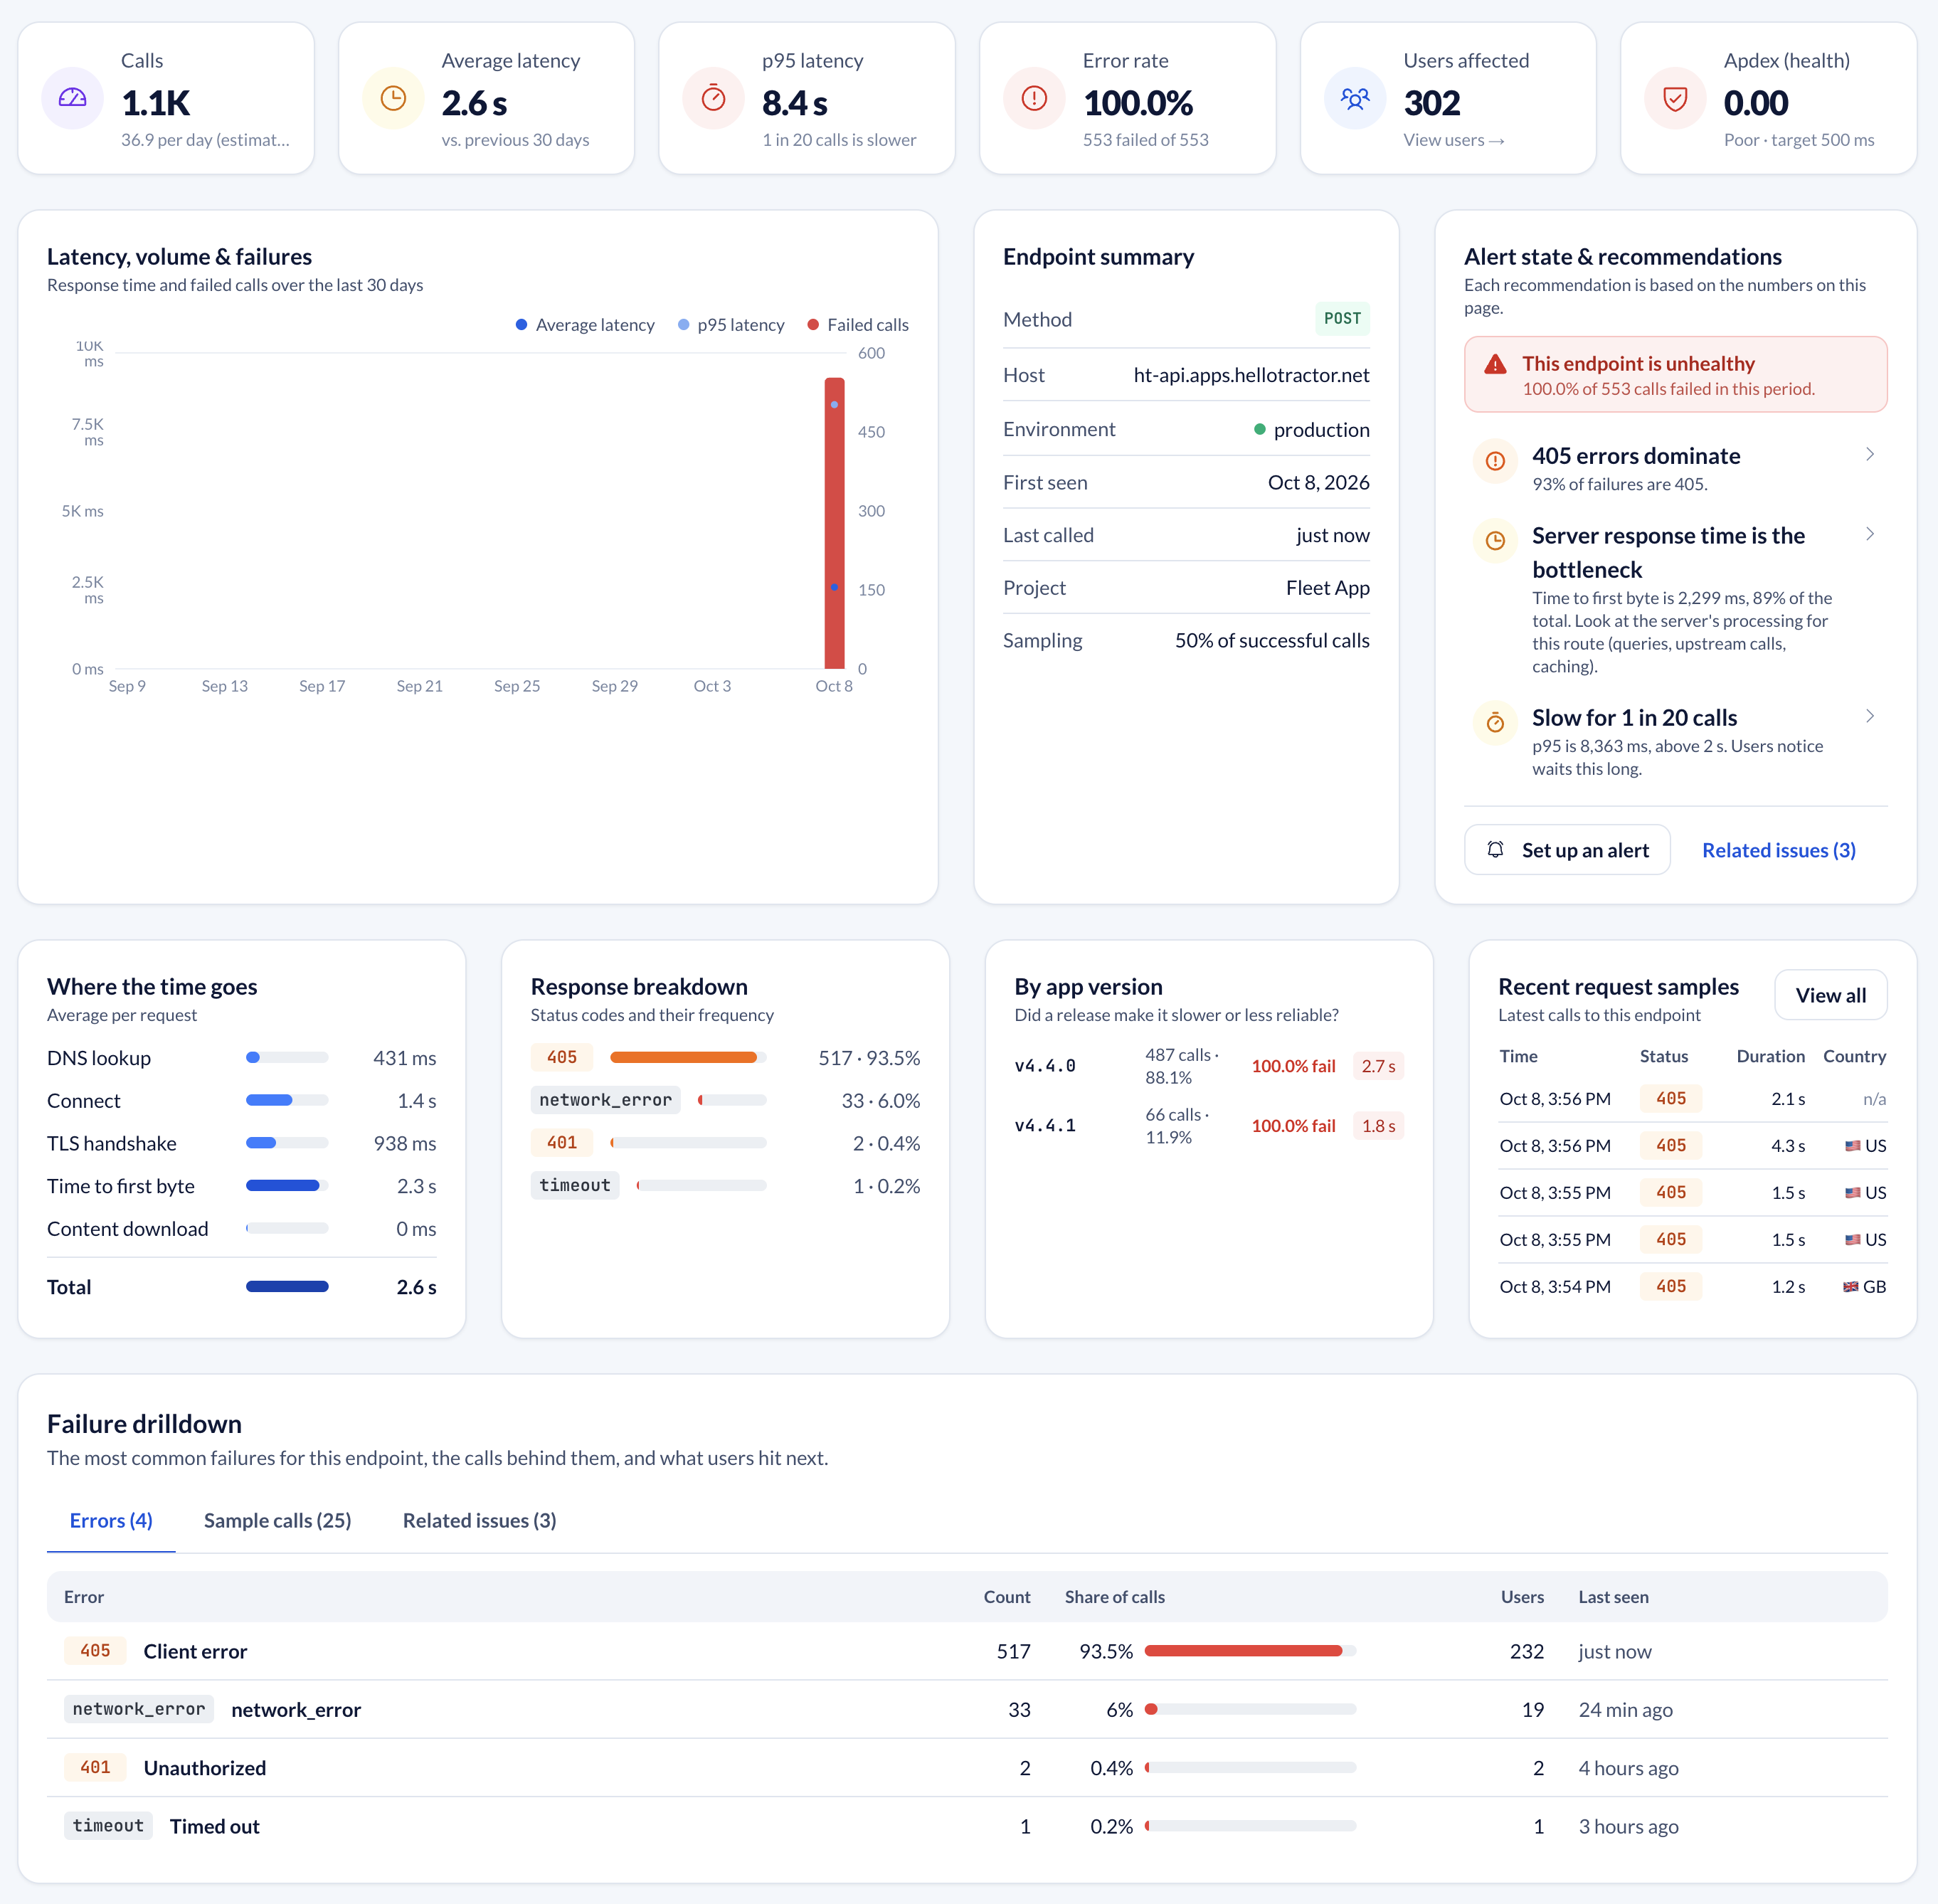
Failed requests become issues grouped by method, path and status, with IDs collapsed (POST /orders/{id} → 500). Latency charts built from the timings are coming to the dashboard; failures are there today. Events are queued on the device and uploaded by WorkManager when there's a connection, so failures that happen because the user lost signal are still reported later.
Note
Codeskop installation docs list OkHttp 4 as the requirement for tracker-okhttp. This is the minimum supported version but will work perfectly with any later versions.
Frequently asked questions
Should I use addInterceptor or addNetworkInterceptor for logging?
For monitoring, use addInterceptor: it sees one outcome per call, including cached responses. Use addNetworkInterceptor to debug what goes over the wire, such as redirects, retries and OkHttp-added headers.
Is it safe to use HttpLoggingInterceptor in production?
Only at NONE or BASIC. At HEADERS or BODY it can log authorization headers, cookies and request bodies. Set the level from BuildConfig.DEBUG and call redactHeader for every credential header.
How do I measure DNS and TLS time in OkHttp?
Use an EventListener with a Factory so each call gets its own instance, and time dnsStart→dnsEnd and secureConnectStart→secureConnectEnd. Pooled connections skip those phases.
Does an interceptor catch timeouts?
Yes. A timeout surfaces as an IOException (usually SocketTimeoutException or InterruptedIOException) from chain.proceed(). Catch it, record it, and rethrow.
Does Codeskop capture request bodies?
No. Codeskop never captures request or response bodies, strips query strings, and never collects Authorization, Cookie or Set-Cookie.