

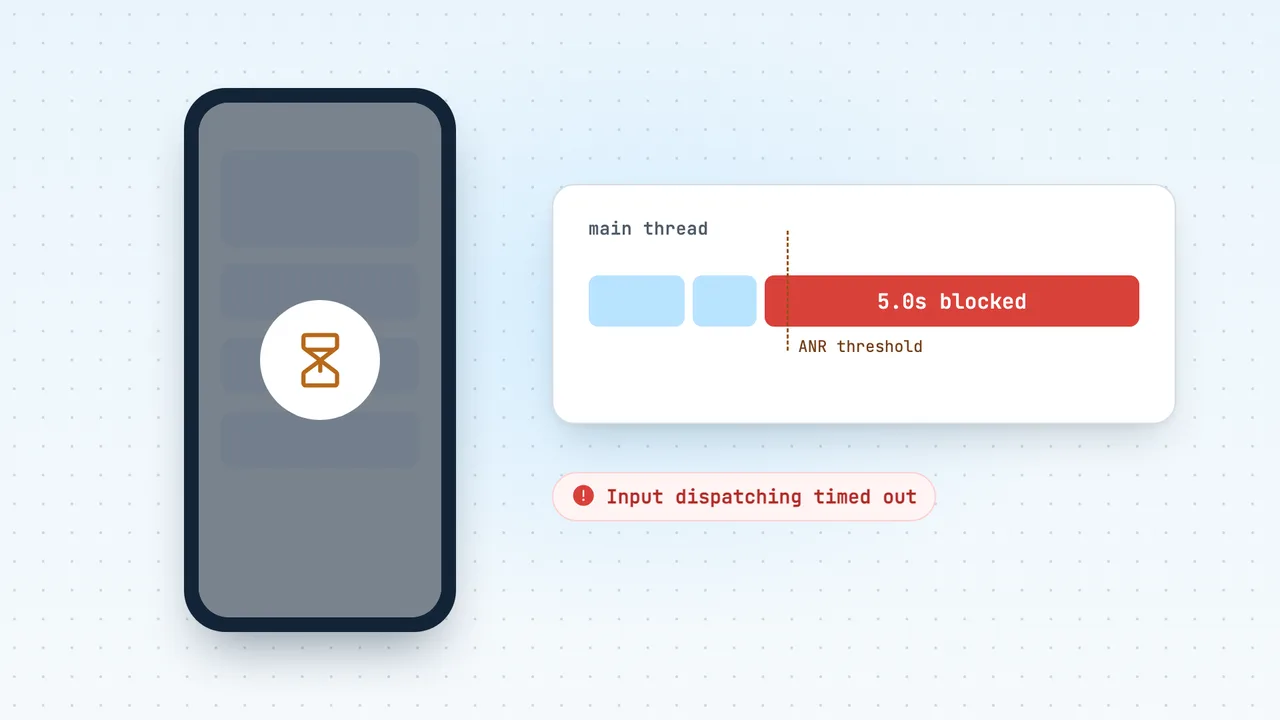
An ANR ("Application Not Responding") happens when your app's main thread is blocked for too long to respond: 5 seconds for an input event, longer for broadcast receivers and services. The fix is almost always the same: move disk, database, network and heavy computation off the main thread (coroutines with Dispatchers.IO, or WorkManager for longer jobs), avoid lock contention with background threads, and keep onReceive() and service lifecycle methods short. Google Play treats a user-perceived ANR rate above 0.47% of daily active users as bad behaviour, so ANRs affect your store visibility as well as your users.
This guide covers the exact timeouts, the common causes with code, how to read a trace, the Android 11+ ApplicationExitInfo API, StrictMode, and how to catch ANRs in production. If you are setting up monitoring now, the Android quick start and ANR monitoring docs cover the Codeskop side. Network calls are a frequent ANR cause, so see also OkHttp interceptors for network monitoring, and if you ship Flutter on Android, Flutter error handling.
What is an ANR?
The system raises an ANR when the UI thread (the main thread) can't do the work it is waiting on in time. On a phone with an app in the foreground, the user sees the "app isn't responding" dialog and can wait or close the app. Background ANRs, for example from a slow broadcast receiver, are often invisible: Android only shows those dialogs when "Show all ANRs" is enabled in Developer options. They still count in your overall ANR rate.
ANR timeouts by type
These are the default timeouts from Android's Diagnose and fix ANRs guide:
| ANR type | Default timeout | Notes |
|---|---|---|
| Input dispatch timed out | 5 seconds | Main thread didn't respond to a touch or key event. The only type counted as user-perceived in Android vitals. |
| No focused window | 5 seconds | A type of input dispatch ANR; often an app too slow to draw its first frame. |
Broadcast receiver, foreground intent (FLAG_RECEIVER_FOREGROUND) | 10 s (Android 13 and lower); 10–20 s (Android 14+, if CPU-starved) | |
| Broadcast receiver, background intent | 60 s (Android 13 and lower); 60–120 s (Android 14+, if CPU-starved) | |
| Execute service | 20 s (foreground service); 200 s (background service) | Covers cold start plus onCreate(), onStartCommand() or onBind(). |
startForeground not called | 5 seconds | After Context.startForegroundService(), per the vitals ANR page. |
| Content provider not responding | Set by the provider | Via ContentProviderClient.setDetectNotResponding(). |
| Slow job response | "A few seconds" | JobService.onStartJob(), onStopJob() or setNotification(). |
Two details matter. First, cold start time counts towards the broadcast, service and content provider timeouts, so a slow Application.onCreate() can turn into an ANR attributed to a receiver. Second, on Android 14+ the broadcast timeouts stretch when the device is CPU-starved, which is common on budget phones.
Catch crashes and ANRs in production
Add com.codeskop.sdk:tracker-android from Maven Central (minSdk 24). It starts on its own, with no init code required.
Android vitals thresholds
Google Play measures two ANR rates in Android vitals:
- User-perceived ANR rate: the percentage of daily active users who experienced at least one user-perceived ANR. Currently only
Input dispatching timed outANRs count. - Overall ANR rate: the percentage of daily active users who experienced any type of ANR.
The bad behaviour thresholds for user-perceived ANR rate are 0.47% across all devices and 8% on any single phone model (5% for a watch model). The matching crash threshold is 1.09%. Play checks a 28-day average daily. If you exceed the overall threshold, your app is likely to be less discoverable everywhere; if you exceed the per-device threshold, it is likely to be less discoverable on that model, and Play may show a warning on your store listing.
The per-device threshold matters in markets dominated by a few budget models. In Kenya, a large share of users can sit on a handful of low-RAM Tecno, Infinix and itel phones. If one of those models freezes on your startup path, it can cross 8% on its own even while your overall rate looks healthy.
Common causes of ANRs (with code)
Android's guide lists the usual suspects: slow I/O on the main thread, long calculations on the main thread, synchronous binder calls to a slow process, waiting on a lock held by another thread, and deadlocks. Here is what they look like in real code.
Disk or database work on the main thread
class ProfileActivity : AppCompatActivity() { override fun onCreate(savedInstanceState: Bundle?) { super.onCreate(savedInstanceState) setContentView(R.layout.activity_profile) // Blocks the main thread: a Room query and a large file read in onCreate val user = db.userDao().getUserBlocking(userId) val avatar = File(filesDir, "avatar.png").readBytes() bind(user, avatar) }}On a flagship with fast storage this might pass unnoticed. On a low-end phone with slow storage and little free RAM, the same code can stall long enough to drop frames or trigger an ANR if the user taps during it.
Blocking on a network call
Android throws NetworkOnMainThreadException if you do network I/O directly on the main thread, so the more common mistake is waiting for a background call from the main thread:
// Looks harmless, but runBlocking parks the main thread until the request finishesfun onPayClicked() { val result = runBlocking { paymentsApi.startStkPush(phone, amount) } showResult(result)}If that payment API is slow, as M-Pesa STK push requests through the Daraja API can be on a congested mobile network, the main thread waits the whole time. Any tap during that wait is an input dispatch ANR in the making.
Lock contention with a background thread
object Cache { private val lock = Any() private var entries: Map<String, Item> = emptyMap() fun refresh() = synchronized(lock) { // background thread, slow entries = api.fetchAll() // network call while holding the lock } fun get(key: String) = synchronized(lock) { entries[key] } // called from the UI}The UI thread calls get(), finds the lock held by refresh(), and waits for the network. In a trace this shows up as the main thread Blocked and "waiting to lock" a monitor held by another thread.
Slow onReceive() or service lifecycle methods
BroadcastReceiver.onReceive(), Service.onCreate() and onStartCommand() all run on the main thread by default. Parsing a large payload or writing to a database there eats into the receiver or service timeout, plus any cold start time.
ANR Codeskop Resolved here:
- Device: generic Google emulator (sdk_gphone16k_arm64)
- Android version: 17 (API 37)
- RAM: about 4 GB, with 4 CPU cores
- Host: your Mac, which makes it much faster than the cheap phones in the Play reports
We reproduced the freeze on an Android 17 emulator (4 GB RAM, 4 cores), not a physical low-end phone. Starting playback on a long day's route blocked the main thread for 1.36 s. Most of that was addMarker calls, about 2.3 s in total across 16 route redraws. Each play/pause toggle added another 0.32–0.36 s. After the fix, the longest block was 0.21 s.
On a low-end phone those times would almost certainly be several times longer. That's why the same code crossed Android's 5-second ANR limit in production but not on the emulator.
How to read an ANR trace
When an ANR happens, Android dumps the stacks of the app's threads. You can see them in Play Console (Android vitals → ANRs), in a bug report from a test device, or on Android 11+ through ApplicationExitInfo (below). Start with the "main" thread and match it to one of the patterns from Android's guide:
| What the main thread shows | What it usually means |
|---|---|
MessageQueue.nativePollOnce / thread idle | The thread was idle when the stack was dumped: a late dump, system pressure, or a leaked sync barrier from touching views off the main thread. Often not actionable for input ANRs, but still worth a look for receiver, service and provider ANRs. |
Blocked and "waiting to lock" a monitor held by another thread | Lock contention. Find the thread holding the lock and see what it is doing. |
| A binder transaction frame | A synchronous call into another process (a system service or a content provider) that is slow. |
Your onReceive(), onCreate() or onStartCommand() | The component's lifecycle method itself is slow. |
ActivityThread.handleBindApplication | Slow app startup. Common in receiver, service and provider ANRs. |
A slow lifecycle method looks like this in Android's own example:
at com.example.app.MyService.onStartCommand(FooService.java:25) at android.app.ActivityThread.handleServiceArgs(ActivityThread.java:4820) at android.app.ActivityThread$H.handleMessage(ActivityThread.java:2289) at android.os.Handler.dispatchMessage(Handler.java:106) at android.os.Looper.loopOnce(Looper.java:205) at android.os.Looper.loop(Looper.java:294) at android.app.ActivityThread.main(ActivityThread.java:8176)Read it top-down: the first frame in your package is where the main thread was stuck. If that frame is a Room DAO call, a File read, SharedPreferences.commit() or a Future.get(), you have found your blocking call.
Finding ANRs yourself on Android 11+: ApplicationExitInfo
From Android 11 (API 30), ApplicationExitInfo tells you why each previous process of your app ended, including ANRs. For an ANR record, getTraceInputStream() returns the trace Android captured. Read it on the next launch, off the main thread:
@RequiresApi(Build.VERSION_CODES.R)fun readRecentAnrs(context: Context) { val am = context.getSystemService(ActivityManager::class.java) // pid = 0 means all processes; keep the last 10 records val exits = am.getHistoricalProcessExitReasons(context.packageName, 0, 10) exits.filter { it.reason == ApplicationExitInfo.REASON_ANR } .forEach { info -> val trace = info.traceInputStream?.bufferedReader()?.use { it.readText() } Log.w("ANR", "ANR at ${info.timestamp}: ${info.description}\n${trace?.take(4_000)}") }}The API returns history, so store the timestamp of the last record you processed to avoid reporting the same ANR twice. On Android 7–10 there is no equivalent, which is why crash tools use a watchdog thread on those versions.
Catching ANRs early with StrictMode
StrictMode flags accidental disk and network access on the main thread while you develop. Turn it on for debug builds only:
class MyApplication : Application() { override fun onCreate() { super.onCreate() if (BuildConfig.DEBUG) { StrictMode.setThreadPolicy( StrictMode.ThreadPolicy.Builder() .detectDiskReads() .detectDiskWrites() .detectNetwork() .penaltyLog() .build() ) } }}penaltyLog() writes each violation to Logcat with a stack trace. Use penaltyDeath() if you want violations to fail loudly in CI or on test devices. StrictMode won't catch lock contention or slow binder calls, so treat it as a first filter, not proof.
How to fix ANRs
Move blocking work to Dispatchers.IO
class ProfileActivity : AppCompatActivity() { override fun onCreate(savedInstanceState: Bundle?) { super.onCreate(savedInstanceState) setContentView(R.layout.activity_profile) lifecycleScope.launch { val (user, avatar) = withContext(Dispatchers.IO) { db.userDao().getUser(userId) to File(filesDir, "avatar.png").readBytes() } bind(user, avatar) // back on the main thread } }}The same applies to the payment example: make the click handler launch a coroutine and show a progress state instead of calling runBlocking.
Replace blocking locks with a coroutine Mutex
Android's guide suggests Mutex.withLock when you use coroutines. A suspended caller doesn't freeze the main thread. Also, never hold a lock across a network call:
object Cache { private val mutex = Mutex() private var entries: Map<String, Item> = emptyMap() suspend fun refresh() { val fresh = api.fetchAll() // network call outside the lock mutex.withLock { entries = fresh } } suspend fun get(key: String): Item? = mutex.withLock { entries[key] }}Keep onReceive() short: use goAsync() or WorkManager
For work that takes a few seconds at most, goAsync() lets you finish off the main thread. You must call finish() on every code path, or the receiver times out anyway:
class SmsReceiver : BroadcastReceiver() { override fun onReceive(context: Context, intent: Intent) { val pending = goAsync() appScope.launch(Dispatchers.IO) { // an application-wide CoroutineScope try { saveIncoming(intent) // short work only } finally { pending.finish() } } }}For anything longer, Android recommends WorkManager. It also survives process death and can wait for a network connection, which helps on patchy mobile data:
class UploadWorker(context: Context, params: WorkerParameters) : CoroutineWorker(context, params) { override suspend fun doWork(): Result = try { uploader.uploadPending() Result.success() } catch (e: IOException) { Result.retry() }} val request = OneTimeWorkRequestBuilder<UploadWorker>() .setConstraints( Constraints.Builder().setRequiredNetworkType(NetworkType.CONNECTED).build() ) .build()WorkManager.getInstance(context).enqueue(request)Speed up startup
Because cold start counts towards several timeouts, trim Application.onCreate(): initialise SDKs lazily or in the background, and avoid disk reads before the first frame. A handleBindApplication frame in your ANR traces is the sign that this is your problem.
Catching ANRs in production with Codeskop
Play Console gives you aggregated ANR clusters. To see ANRs next to your crashes and failed API calls, with the device, app version and user for each, you can use a crash tool. Codeskop's Android SDK reports ANRs automatically on the Starter plan and above ($49/month as of October 2026; the Free plan doesn't include ANR detection, see pricing).
Add the dependency:
dependencies { implementation("com.codeskop.sdk:tracker-android:0.3.0") implementation("com.codeskop.sdk:tracker-okhttp:0.3.0") // optional: network capture}Then either add your key to AndroidManifest.xml (zero code; the SDK starts through App Startup) or initialise in code:
class MyApplication : Application() { override fun onCreate() { super.onCreate() CodeskopAndroid.init(this, CodeskopConfig(apiKey = BuildConfig.CODESKOP_KEY)) }}How it detects ANRs, per the ANR monitoring docs:
- Android 11 and higher: the SDK reads Android's own exit records (the
ApplicationExitInfodata above) on the next launch and reports each ANR once, with Android's description. Nothing runs while your app is in use. - Android 7 to 10: the SDK runs a low-priority watchdog thread. If the main thread stays blocked for about five seconds, it records an ANR. Treat these as main-thread freezes worth investigating, because the watchdog can't tell whether Android actually showed the dialog.
- ANRs are never sampled away and never dropped to free queue space. Events are stored on the device and uploaded when there is a connection, so ANRs from users on intermittent data still arrive.
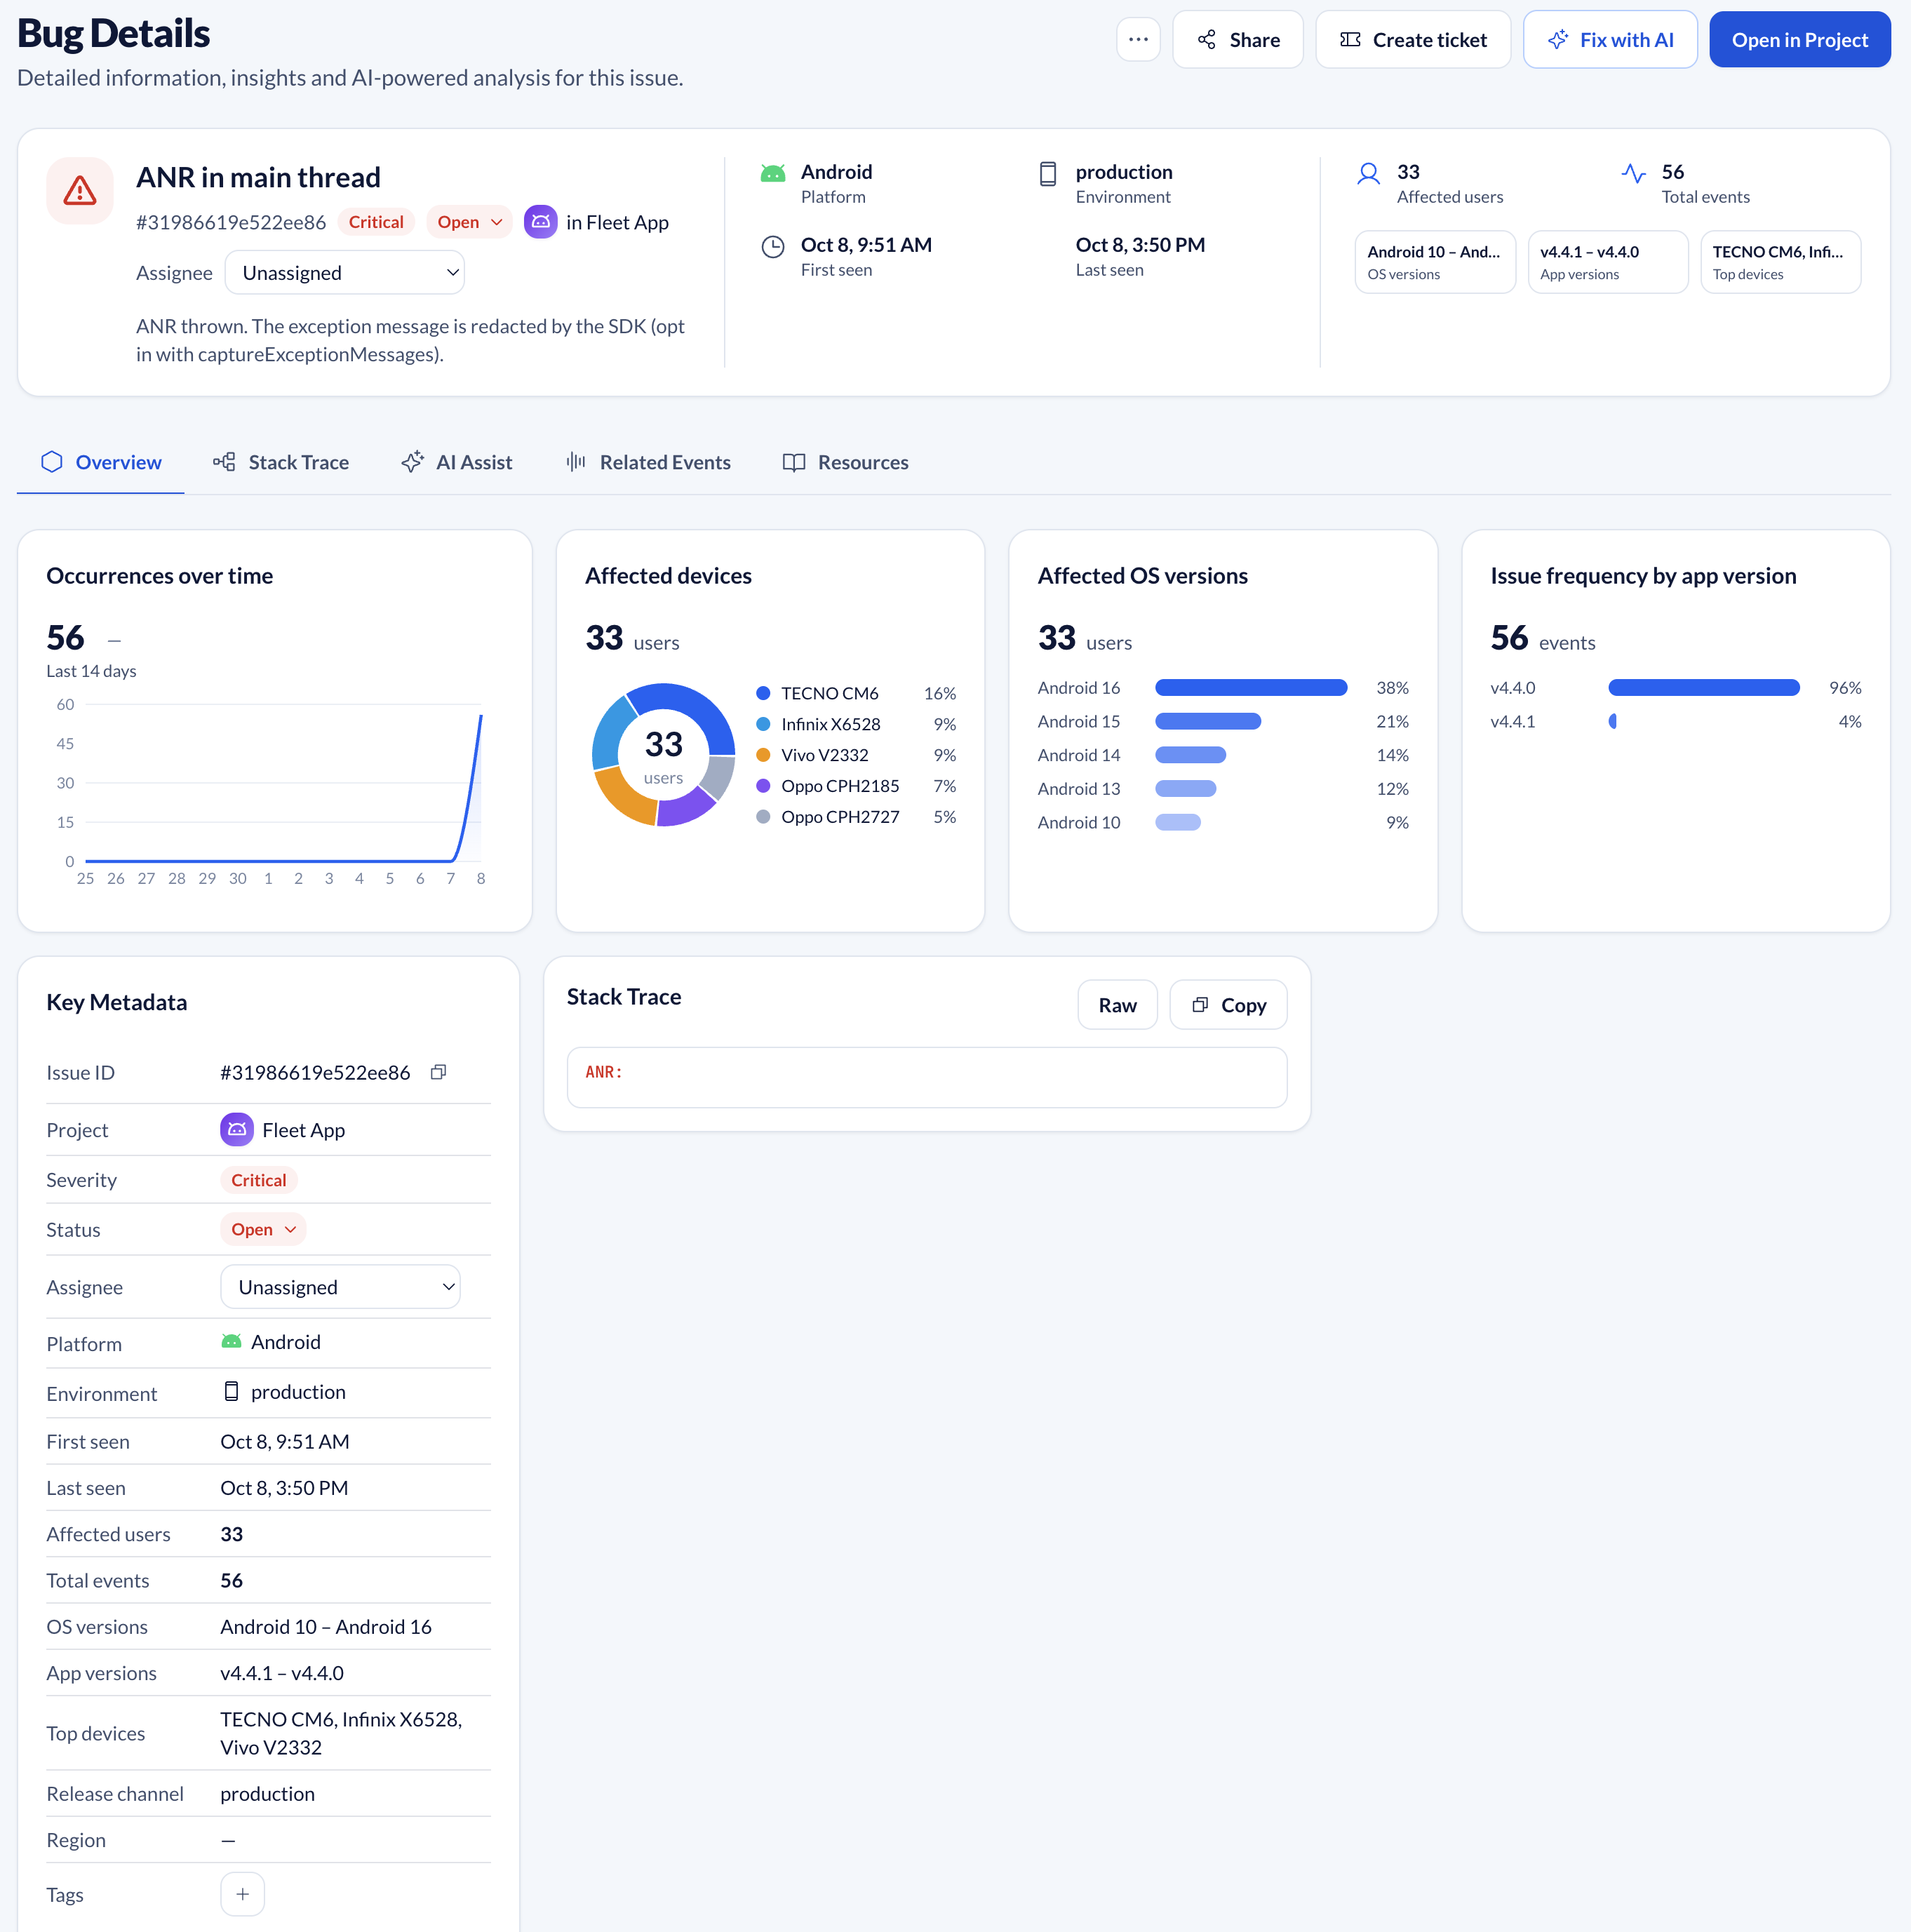
What Codeskop shows today: in SDK 0.3.0, ANR reports don't yet include a main-thread stack trace. To find the cause, group ANRs by app version, device and screen, and look for the main-thread disk, database and network work described above. For the trace itself, use Play Console or the ApplicationExitInfo code in this guide.
Frequently asked questions
What is the ANR timeout on Android?
5 seconds for input events (touches and key presses) and for calling startForeground(). Broadcast receivers get 10 seconds for foreground intents and 60 seconds for background intents (longer on Android 14+ if the CPU is starved). Services get 20 seconds in the foreground and 200 seconds in the background.
What ANR rate is acceptable on Google Play?
Stay below a 0.47% user-perceived ANR rate across all devices and below 8% on any single phone model. Those are Android vitals' bad behaviour thresholds; above them, Play may reduce your app's visibility.
Is an ANR the same as a crash?
No. A crash is an uncaught exception that ends the process. An ANR is a freeze: the process is alive but the main thread is blocked. The user may close the app from the dialog, and Play tracks the two rates separately.
Can I detect ANRs without a third-party SDK?
Yes. On Android 11+, read ActivityManager.getHistoricalProcessExitReasons() on the next launch and filter for REASON_ANR. Play Console also shows ANR clusters. Older Android versions need a watchdog approach.
Does Codeskop capture ANRs on the Free plan?
No. ANR detection starts on the Starter plan. Upgrading turns it on from the next app launch without a new release.